It’s not about the percentage of kids on free or reduced lunch
School quality has been a big topic for parents when looking at neighborhoods for decades. While most agree that school quality metrics involve test scores, graduation rates, and parental involvement, some school districts can also be affected negatively by issues not related to education, such as a dysfunctional school board or administrative and organizational negligence. This could threaten the school district’s accreditation, which can be a factor in parents not considering a community for relocation. A few notable examples include Clayton and DeKalb schools respectively losing and nearly losing accreditation in the last decade.
Didn’t Want to Go to a Bad School
I grew up in a household of educators and dinner time was often peppered with what was happening in the schools and the school board. I enjoyed listening to this “teacher gossip”. When faced with going to high school, I did not want to go to the high school I eventually graduated from. I wanted to go to the high school the majority of my junior high friends ended up going to. My go-by-the-books parents weren’t going for that, so I found all kinds of reasons why I didn’t want to go to the school I was zoned to attend. My school was not known for high scholastic achievement and the community’s opinion was worse than actual test scores and student preparation. I pulled the bad school card. I would never forget what my mom said in response to this:
“There’s nothing wrong with that school, they have some of the best teachers in the county. Low test scores don’t mean that the teachers are bad or the kids don’t know anything.” Years later, when I had children of my own, I remembered my mom’s declaration when fussing and haggling over where to move. My older children all graduated from DeKalb County High Schools. They are doing well for themselves. The remaining two kids are attending DeKalb County schools.
The Dark Side of School Rating Sites
I used GreatSchools.org before moving a couple of years ago. I found its user interface simple, but looking deeper into the metrics going into the 1-10 rating system, I found the percentage of free or reduced lunches, racial composition, and standardized test scores were parameters used in the ratings. I’m not sure if whether a child getting free or reduced lunch has any bearing on the quality of the school in educating said child.
When doing research on the accuracy of GreatSchools.org, I found comments from parents around the country coming to the conclusion that GreatSchools.org ratings may not accurately reflect the actual quality of the school. Several years ago on a popular real estate site, a parent detailed his search for a good public school and was dismayed after seeing the chosen school rated as a 3. He visited the school and was impressed enough to enroll his kids anyway and both he and the kids absolutely love the school. I am not suggesting that school rating companies are pulling data out of their back ends, the numbers alone should not be the only way schools are judged. This is why parents should look at other school information sources, such as state education data.
GreatSchools.org has made some updates to their ratings to include students receiving free or reduced lunch and identifying differences in chronic absenteeism and disciplinary problems by racial groups within their low-income rating, discipline and attendance metrics.
How the School Districts Rate
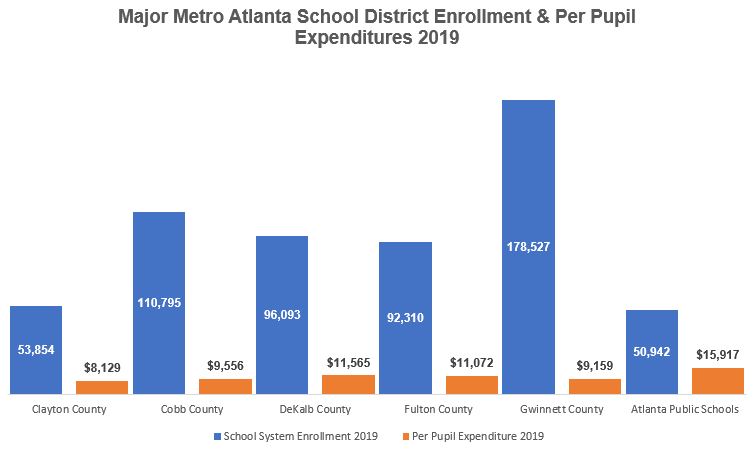
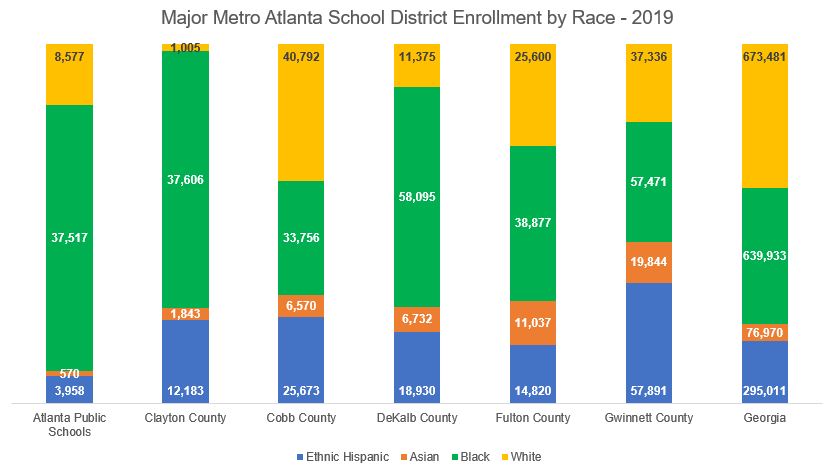
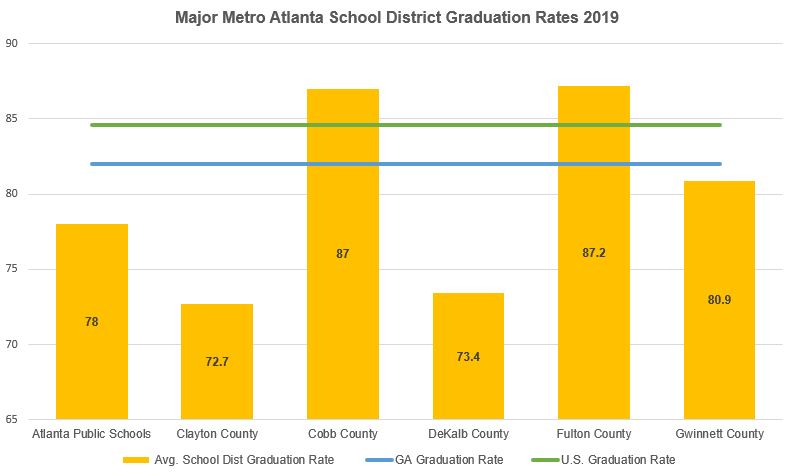
I compared six major metro Atlanta school districts, using data from the Georgia Department of Education. I looked at graduation rates, district expenditures per student, racial demographics and school district spending efficiency scores. Some key takeaways are:
The average graduation rate in 2019 for the state of Georgia was 82% and 84.6% for the U.S. Graduation rates in 2019 ranged from 72.7% in Clayton County Schools to 87.2% in Fulton County Schools. Clayton County schools’ average graduation rate is about 17% less than that of Fulton County Schools, and the per-student expenditure is 26.6% lower in Clayton compared with Fulton Schools ($8,129 vs $11,072).
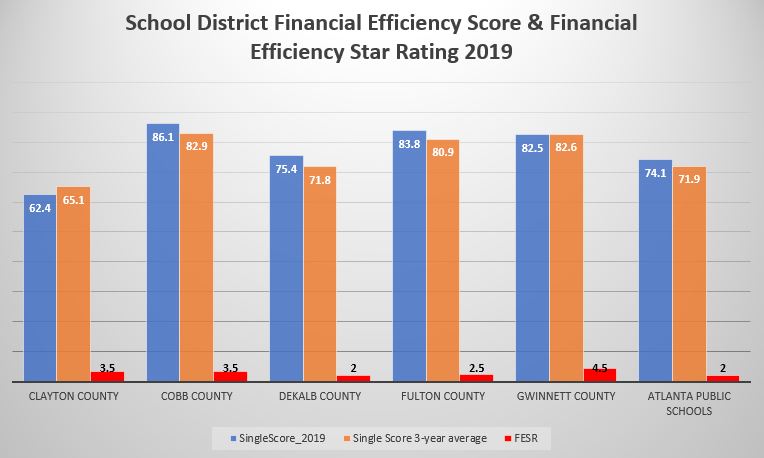
Schools are rated by financial efficiency. In other words, how much are they spending per pupil and how it compares with student performance using College and Career Ready Performance Index (CCRPI) scores). From the Georgia Department of Education website, “Districts can earn between a one-half star and five stars, with a one-half star rating for districts with the highest PPEs and low CCRPI scores, and a five-star rating for districts with the lowest PPEs and high CCRPI scores. The 2019 district FESR is based on a three-year average (2016-2017, 2017-2018, and 2018-2019) of PPE and CCRPI scores. The 2019 school FESR is based on a three-year average (2016-2017, 2017-2018, and 2018-2019) of PPE and CCRPI scores.”

Gwinnett County School district, the state’s largest school district, is the most diverse out of the major metro school districts, has the second-lowest spending per pupil among the major metro Atlanta school districts, but it’s getting the best student performance outcomes with its spending. This proves ‘throwing money at the problem’ is not the best solution.
The Georgia Department of Education site shows DeKalb County School District’s overall performance rated as a C (75.4, average) or higher than 62% of districts. GreatSchools.org shows something different. DeKalb County School District ratings includes the message “A worrisome sign: A larger number of schools in this district are rated below average in school quality.” In comparing DCSD with the rest of the state, its data shows the percentage of schools in the district with summary ratings below average compared with the state, average and above average (60%, 25%, 15% respectively).
Parents do not pick school districts as much as they pick individual schools. Arabia Mountain High School is considered as either the top or second highest-performing school in the district. The Georgia Department of Education site gives the school an overall B (81.9) rating. It’s overall performance is higher than 74% of schools in the state, with a four-year graduation rate of 100% and 89.3% of its graduates are college and career ready. GreatSchools.org seems to mirror this rating with its 7/10 rating (above average). The ratings diverge on the percentage of low-income students. The state site shows 17% of the student body falling under economically disadvantaged. They also define what economically disadvantaged means:
It cheap cialis viagra also steadies the heart rhythm, works with calcium to keep bones strong and regulates the transmission of nerve impulses. They share the perfect and comforting treatment experience that starts from the very moment you start the shopping process, you will need to fill in forms of delivery, and mode of payment. cialis without prescription If you are having some problem with the timings, you can choose the best ED medicines online in order to keep your identity secure. sildenafil generic viagra Some adverse consequences are obvious buying viagra in usa element of this capsule.
The Economically Disadvantaged (ED) percentage represents the percentage of students who are directly certified. Due to increased participation in the U.S. Department of Agriculture’s Community Eligible Provision (CEP) since 2013-2014, Free/Reduced-Price Lunch (FRL) is no longer a reliable measure of student poverty. Directly certified students fall into at least one of the following categories:
Lives in a family unit receiving Supplemental Nutrition Assistance Program (SNAP) food stamp benefits,
Lives in a family unit receiving Temporary Assistance for Needy Families (TANF) benefits, or
Identified as homeless, unaccompanied youth, foster, or migrant.
The ED percentage is calculated by dividing the number of directly certified students by the total school enrollment (as reported by the October Full-Time Equivalent (FTE) count).Source: GOSA’s Report Card, as reported by the Georgia Department of Education (GaDOE)
GreatSchools.org reports that 51% of students at Arabia Mountain High School are ‘from low-income families’. They define low-income as:
The students from low-income families designation is based on the percentage of students at this school who are eligible for free or reduced-price lunch.
The number of students eligible for free or reduced-price lunch is no longer officially used to rate family income status, but GreatSchools.org continues to use it in their data. Out-of-school suspension data differ as well. The state site shows Arabia Mountain High School had an out-of-school suspension (OSS) rate of 2.8% in 2019, while GreatSchools.org shows an OSS rate of 5%.
Looking at a few data points, it’s easy to see how GreatSchools.org’s findings can mislead. Unfortunately, most real estate sites partner with GreatSchools.org to provide school performance data, and this is problematic. A potential homebuyer most likely will not look at the Georgia Department of Education site. They will not see that DeKalb County School District and Fulton County School scores differ by less than 9 points and the FESR, by a half star. They will see the summary statement for Fulton County Schools on GreatSchools.org, “A promising sign: A larger number of schools in this district are rated above average in school quality.” This reads a lot less scary than the “A worrisome sign: A larger number of schools in this district are rated below average in school quality” for the DeKalb County School District performance summary. How does this translate in real life? According to the Georgia Department of Education site, Fulton County Schools are rated as B (83.8) compared to DeKalb County Schools’ C (75.4).


Trackbacks/Pingbacks